

The content provided in this article is for informational purposes only. It does not constitute financial advice and is not intended as, and shall not be understood or construed as, financial advice. Readers are encouraged to conduct their own research and consult with a qualified financial advisor before making any investment decisions. The author shall not be held responsible for any financial losses or decisions made based on the information provided in this article. Always perform due diligence and seek professional advice before making any financial decisions.
Approximately one year ago, we published this article on the Substack 👇

In it, we stated the following:
“An epic collapse is coming, and it’s going to be big.
Exactly when it happens – next week, next month, or next year – I can’t know. But I do know this – all the other times we’ve seen what we see now, it turned out badly.”
That article looked at several datapoints related to the U.S. stock market, as well as the cryptocurrency market.
Where do these metrics stand now? Are we still in the biggest speculative bubble since 1929?
Unfortunately, the answer is yes.
Since that article was published, the data has actually gotten worse. The market extremes are unprecedented, even when compared to 1929.
Now, when I make such statements, comments inevitably pop up along the lines of “You’ve been saying this for years now.” Implied in such comments is the idea “we’re NOT in a bubble.”
But keep in mind, just because we haven’t seen a market crash yet isn’t evidence we’re not a bubble.
In the years leading up to the 1929 crash, a number of people pointed to similar data showing extreme overvaluations in the U.S. stock market – and they did so throughout 1926, 1927, 1928, and early-1929.
Those voices were derided as out-of-touch doomsayers, but in hindsight, the data was clear.
In this article, we’ll examine what the data is telling us right now versus what it told us last year.
So let’s start with this…
The Buffett Indicator
The Buffett Indicator gets its name from famed investor Warren Buffett. Reportedly, this is his favorite metric for judging whether or not the stock market as a whole is fairly valued.
The Buffett Indicator takes the total value of the U.S. stock market and divides it by the gross domestic product (GDP). This compares the value of stocks to the total value of the U.S. economy. At fair value, Buffett says the ratio should be about 60%.
Last year, it was 203% 👇
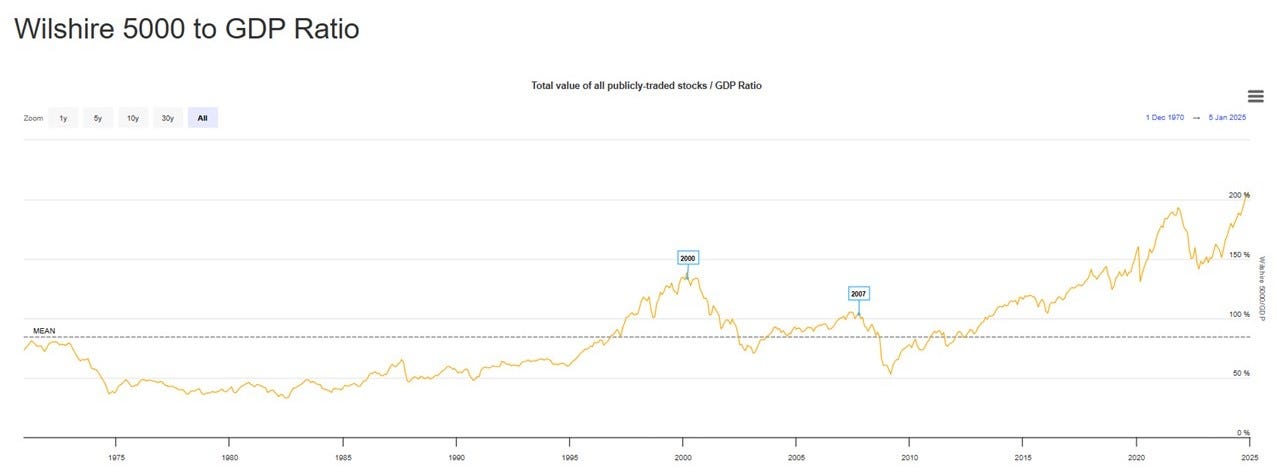
Here’s where it currently stands 👇

As you can see right now, at over 222%, the Buffett Indicator is almost 10% higher than the unprecedented overvaluation we saw last year.
In other words, we’re in completely uncharted territory.
While the chart above only goes back to 1970, you can see the peak of the Dot-Com Bubble was around 138%. Right before the Great Financial Crisis, it was 105%. Estimates put the Buffett Indicator in September 1929 at roughly 130%.
Right now, it’s higher than ever. We’re at entirely new levels of extreme.
I don’t know when this bubble will pop, but history says it will. Whenever we’ve seen these conditions in the past, it’s always ended in tears. Every time, it’s ended with at least a major market correction, and in most cases, an outright crash.
Perhaps this time is different.
But history tells us that’s highly unlikely.
S&P 500 Price-to-Sales Ratio
Another extreme we saw in January 2025 (and we still see today) is the S&P 500 price-to-sales ratio. Here’s the current chart 👇

Last year, this ratio was at a then all-time high of 3.07. Today, it’s 3.36 – the highest on record.
As you can see, the data on this chart only goes back about 30 years. But you can see in the lead up to the Dot-Com Bubble, it was 2.11.
We’re now at a peak the market has never reached before. And while the entire market is overvalued, just a few stocks drive all the indices.
Here’s a list of the top 7 stocks in the S&P 500 and what percentage of the index they constitute 👇
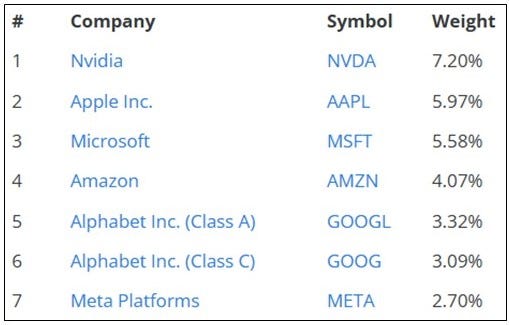
Last year, the top seven stocks made up 31.84% of the S&P 500. Today, the top seven stocks make up 31.93% of the S&P 500 – a marginally higher figure.
But think about this… The top seven stocks make up more than 30% of the total value of the S&P 500 – just 7 companies out of 500.
Does that surprise you? It should.
When most people buy an S&P 500 index fund (a popular investment for many retirement accounts), they think it means they’re buying an equal share in all 500 companies in the index, but they aren’t equally weighted. For example, Nvidia is only 1/500th of the S&P 500, but it constitutes 7.20% of the S&P 500’s value.
The top seven stocks equal almost a third of the entire value of the index, even though those seven stocks are just a little bit more than 1% of the number of companies in the index. This means we’ve lost sight of the biblical principle of diversification.
We read that in this passage 👇
“Send your grain across the seas, and in time, profits will flow back to you. But divide your investments among many places, for you do not know what risks might lie ahead.” Ecclesiastes 11:1-2 (NLT)
History is clear…
When you deviate from biblical principles, bad things happen.
So what’s the price-to-sales ratio for each of these companies? Here’s the list:
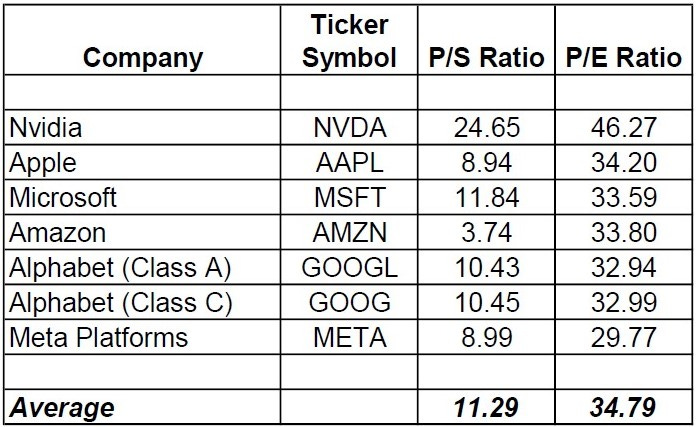
Out of the top seven stocks, four have a price-to-sales ratio of 10 or higher. This is down from five last year, but keep in mind, the top seven stocks today are not the exact same seven from last year (Tesla and Broadcom were replaced by Google Class A and Class C shares).
Why does a price-to-sales ratio of 10 or higher matter? In the aftermath of the Dot-Com Bubble, the CEO of Sun Microsystems explained why in a very famous interview. He said:
“At 10 times revenues, to give you a 10-year payback, I have to pay you 100% of revenues for 10 straight years in dividends. That assumes I can get that by my shareholders. That assumes I have zero cost of goods sold, which is very hard for a computer company. That assumes zero expenses, which is really hard with 39,000 employees. That assumes I pay no taxes, which is very hard. And that assumes you pay no taxes on your dividends, which is kind of illegal. And that assumes with zero R&D for the next 10 years, I can maintain the current revenue run rate. Now, having done that, would any of you like to buy my stock at $64? Do you realize how ridiculous those basic assumptions are? You don’t need any transparency. You don’t need any footnotes. What were you thinking?”
In light of what you just read, think about where we stand today. Four of the top seven stocks, comprising almost a third of the S&P 500, sport a price-to-sales ratio exceeding 10. Some of them are even higher than 10. NVIDIA is 24.
All of the fundamentals that applied to the overvalued stock of Sun Microsystems during the Dot-Com Bubble now apply to four of the biggest companies in the world.
To understand what that means, just take a look at this chart of Sun Microsystems from 1996 to 2006 👇
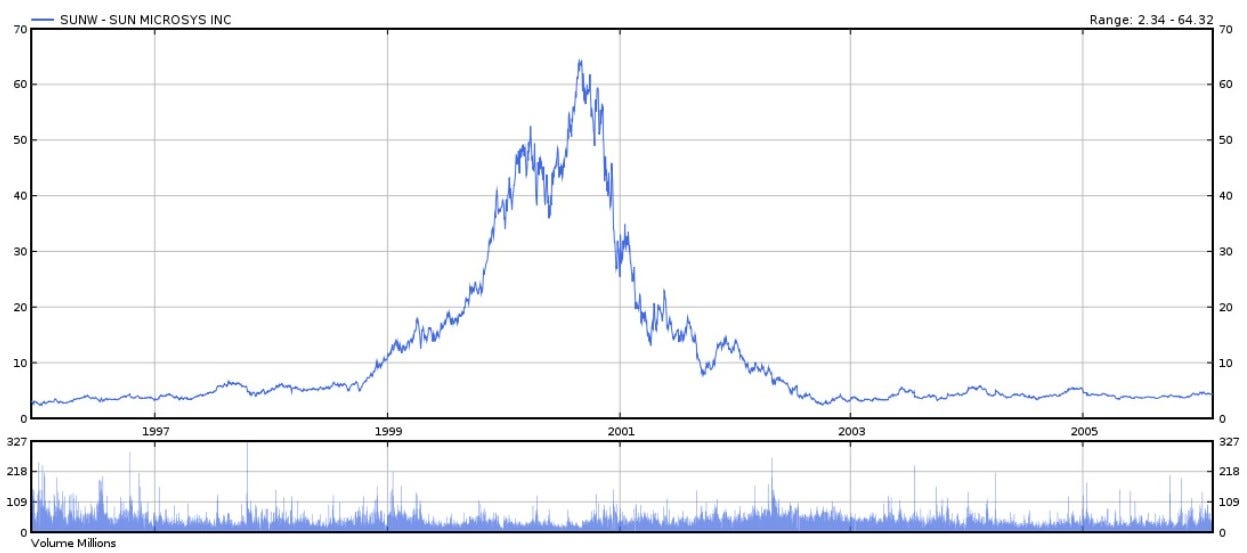
Sun Microsystems stock started at around $5 per share, ran up to $64 per share, and then fell right back down to $5 per share. You would think this might serve as a cautionary tale for investors today, but obviously, the lesson wasn’t learned.
Unprecedented Market Concentration
Here’s an X post from @value_charts:

It shows the top 10 stocks in the S&P 500 are now more than 35% of the index (38.4% as of this writing). Not even the lead up to the 1929 crash saw market concentration this high. It’s now almost twice as concentrated as the Dot-Com Bubble.
Right now, we’re at unprecedented levels of concentration.
Again, this will not end well. The markets have strayed from the biblical principle of diversification as recorded in Ecclesiastes 11. Investors are not buying 500 individual stocks equally weighted when they buy S&P 500 index funds. They’re buying a handful of companies trading at extreme overvaluations.
However, as we pointed out last year, these bubble conditions weren’t limited to the S&P 500 alone. Last year began with rampant speculation in cryptocurrencies, especially meme coins.
But unlike the U.S. stock market, the cryptocurrency bubble DID pop last year.
Let’s take a look at what happened…
Dogecoin
In last year’s article, we highlighted Dogecoin. Here was the chart of Dogecoin at the time 👇
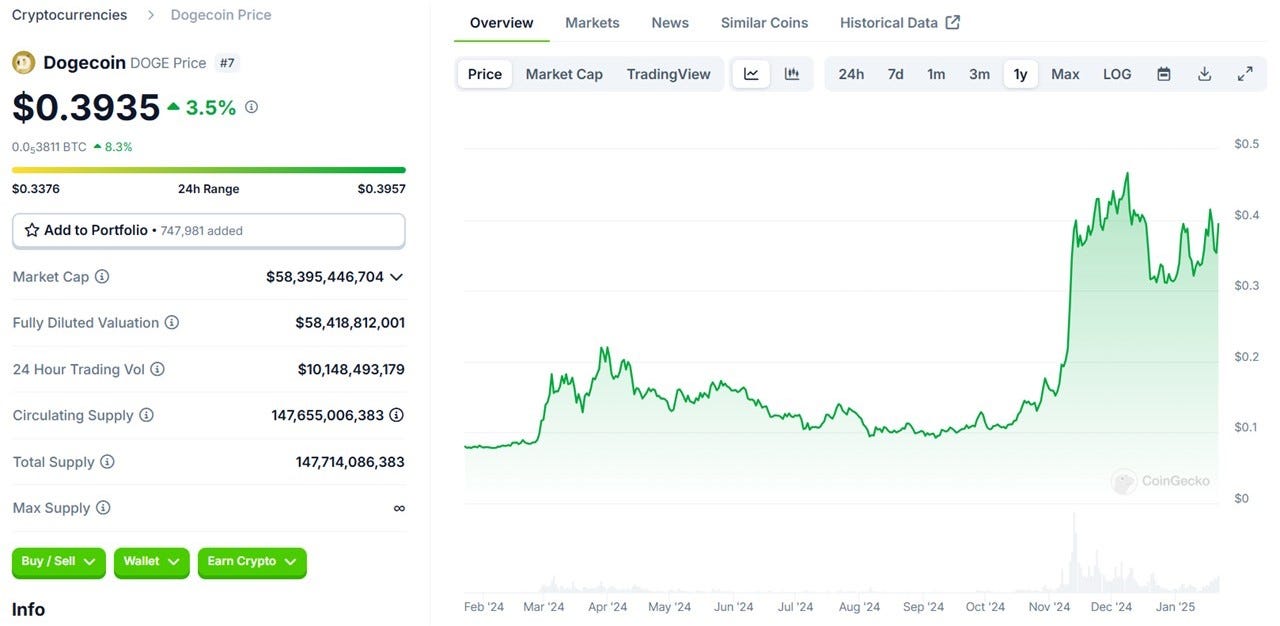
In January 2025, Dogecoin had a total value of $58 billion. $58 billion!
What is Dogecoin? It’s more than a cryptocurrency. According to Wikipedia:
“Dogecoin is a cryptocurrency created by software engineers Billy Marcus and Jackson Palmer, who decided to create a payment system as a joke. making fun of the wild speculation and cryptocurrencies at the time. It’s considered both the first meme coin and more specifically the first dog coin. Despite its satirical nature, some think it’s a legitimate investment prospect.”
Dogecoin is a joke – literally. Its founders created it 11 years ago as a meme coin parody. It’s since attracted billions of dollars in speculation.
As stated in last year’s article:
“This will not end well.
The people who think they’re “investing” in Dogecoin are really speculating and gambling on Dogecoin. They expect it to go higher and higher so they can eventually cash out and become rich. But history tells us only a few people will cash out at the top. The overwhelming majority will lose a lot of their life savings, pouring their hard-earned savings into joke meme coins.”
Where do we stand today? Here’s the chart 👇

Dogecoin today is collectively worth $20.4 billion – still an extreme overvaluation for a joke meme coin. But that’s also 65% less than it was worth when last year’s article was published.
But Dogecoin wasn’t the only joke meme coin we looked at last year. We also covered something I never thought I’d be talking about – “Fartcoin.”
This work is a full-time endeavor for our family. Without the support of readers, viewers, and listeners like you, the work we do here would not be possible. If you receive value from this content, please consider becoming a paid subscriber.
As a paid subscriber, you’ll get weekly paid-subscriber videos and/or articles, a monthly live Q&A via Zoom, commenting privileges on every post, access to the complete archives, and more. Most of all, you get to support this work which spreads the Good News of Jesus Christ to tens of thousands of people in over 121 countries.
Fartcoin
In last year’s article, we highlighted the following chart of Fartcoin 👇
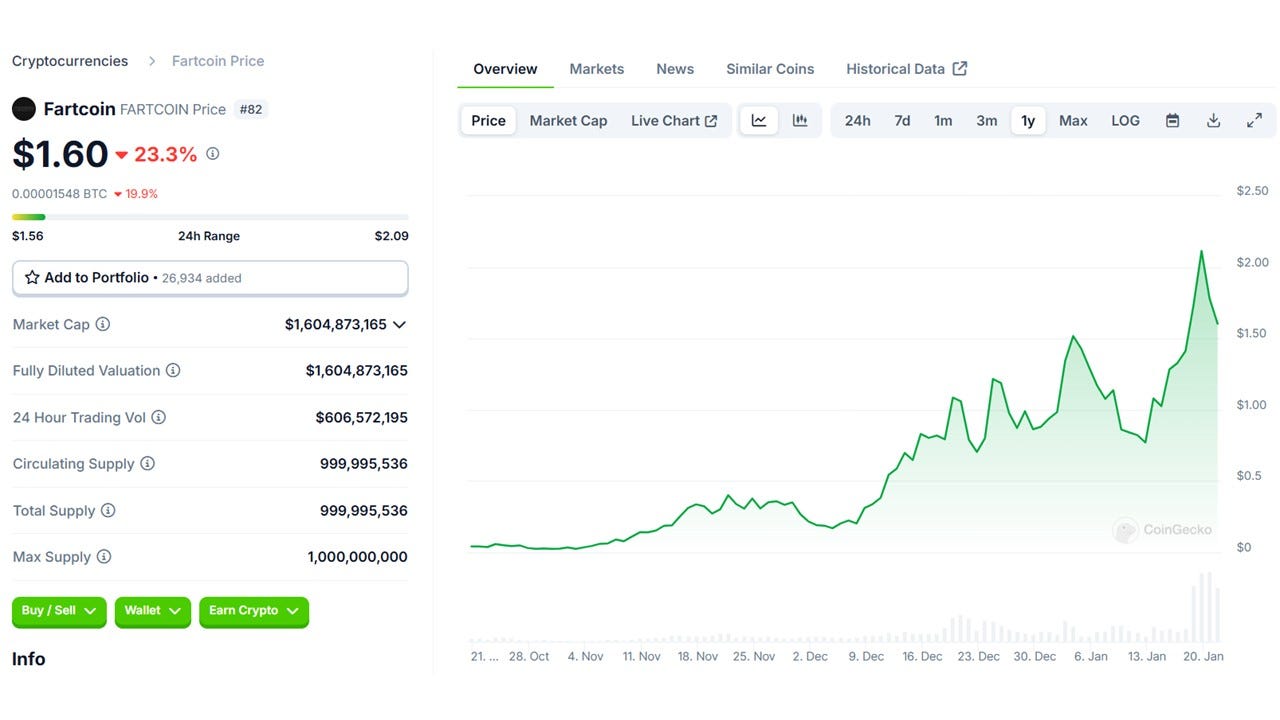
At the time, Fartcoin was worth $1.6 billion. Why? Was it because Fartcoin had great value to offer the world? Is it because Fartcoin promised to spark a revolution in how the world does business? No.
Fartcoin’s billion dollar valuation was the result of speculation and gambling.
Much like we saw in the lead up to the 1929 crash and the lead up to the Dot-Com Bubble where people would buy anything with dot-com in its name, people were buying up meme coins in early 2025. The valuations were absurd. In last year’s article, we used this X post to put the overvaluation in perspective:
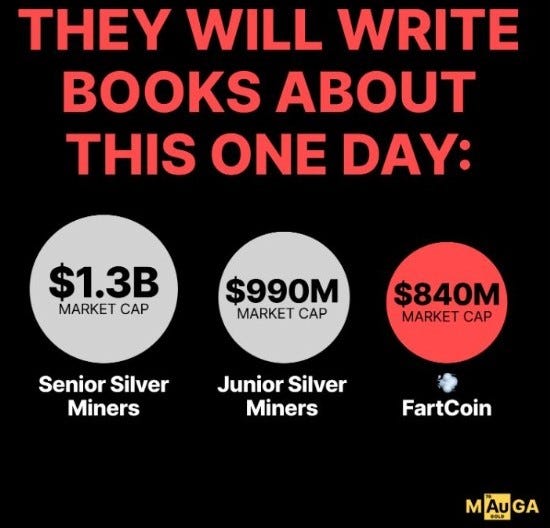
That post was from December 16, 2024. Fartcoin was even higher in January 2025.
In January 2025, Fartcoin was valued at $1.6 billion. In contrast, all the junior silver miners were valued at $990 million, and all the senior silver miners (meaning all the publicly traded senior silver mining companies) were worth $1.3 billion. “Investors” valued Fartcoin more than the world’s leading silver mining companies.
This made no sense outside of a bubble. If Fartcoin disappeared, no one (other than the people speculating in it) would notice.
But if all the silver miners disappeared? The world as we know it would come to a screeching halt.
As noted in last year’s article:
“Silver is essential to modern life. We can’t make cell phones or computers or almost anything electronic without silver. To say Fartcoin is more valuable is grossly absurd.”
Here we are one year later, and what do we see?
Silver is at all-time highs:

While Fartcoin has lost 82% in value:

For those who are paying attention, the parallels between today and 1929 are clear. We’ve had joke meme coins created out of thin air valued at billions of dollars. People continue to wildly speculate in the markets, hoping to strike it rich.
Just like 1929, we see extensive use of leverage in the markets through complex options and borrowing on margin. And of course, we see massive overvaluations – overvaluations at extremes we haven’t seen since 1929.
So how will all this end?
Here are some possibilities based on what’s happened in the past:

As mentioned last year, we can’t know when it will all come crashing down, but we do know whenever we look through history and see these patterns, it doesn’t end well.
Setting the Stage for the Antichrist
So why bring all this up? Why the continued focus on these economic issues? Because what’s happening in global financial markets is directly relevant to bible prophecy. As mentioned in the article, “How the Current Global Financial Crisis Leads to Biblical Tyranny in 10 Steps,” current conditions will lead to the greatest financial crisis in human history.
This will involve more than just a stock market crash or a commercial real estate crash or a residential real estate crash, all of which are happening or are on their way to happening. It will also involve a currency crisis. And it will involve a sovereign debt crisis as countries – entire nations – collapse under the weight of the debt they’ve piled up decade after decade. The result will be a deflationary spiral worse than the Great Depression.
Eventually, all this will result in a bank holiday, and the rollout of a new digital system built on stablecoins and central bank digital currencies (CBDCs), tokenized assets, and digital IDs. They’ve already told us this is what they want to do.
They’ve been telling us for years 👇
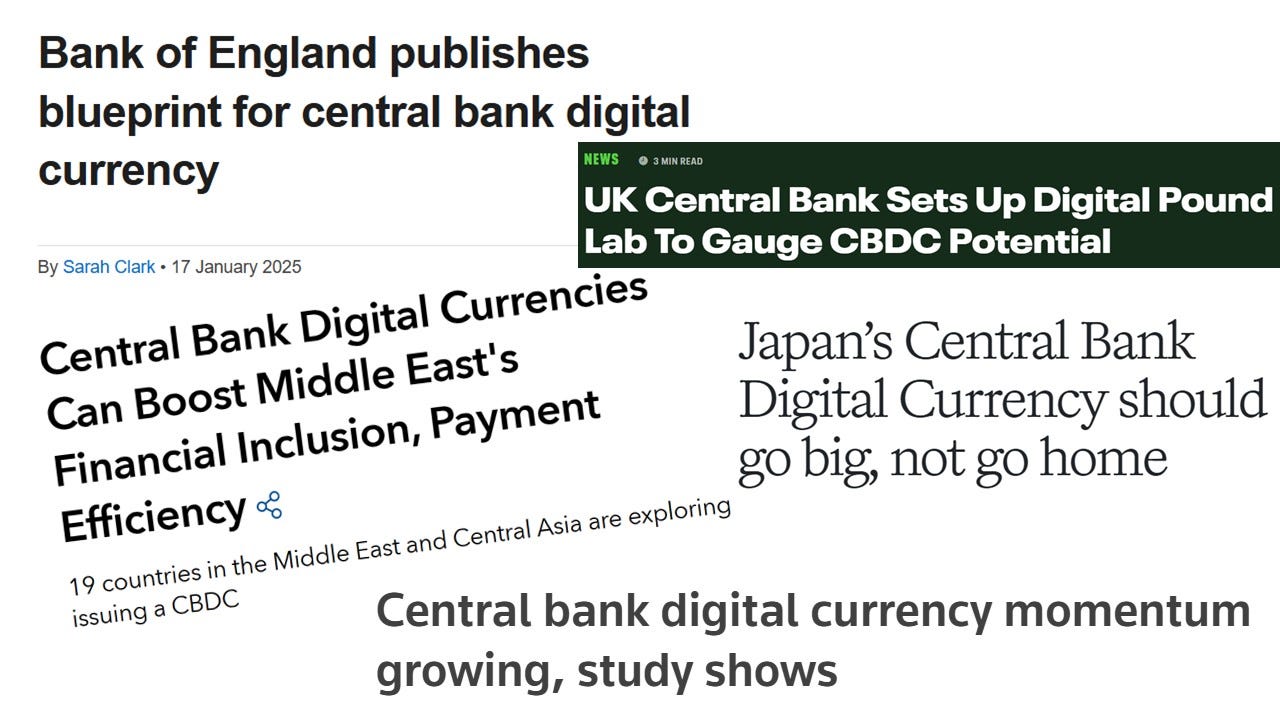
Here’s a website where they track the roll-out status of CBDC all over the world.
Why are they doing this? Because they know we’re at the end of the current debt-based monetary system. They know it will collapse in the near future, and they need to replace it with a new system that solidifies the power of those who are in power now. And this is the system they’ve decided on – digital currencies, tokenized assets, and digital IDs.
Why does that matter? Because those three technologies, when implemented, are indistinguishable from the mark of the beast system in terms of function and capability.
In and of themselves, they aren’t the mark of the beast. But they create a system where the government will have insight into every financial transaction.
And they won’t just surveil those transactions, they’ll have the ability to control them – the ability to cut them off, redirect them, and/or place limits on them. Such a system gives the people in authority complete and total control over every aspect of human life.
How will they convince people to accept such a system?
The answer is simple – through a crisis.
The greatest financial and economic crisis in human history is exactly what they need. When people are desperate, when they can’t afford food, when they can’t afford rent, when they can’t make the mortgage payment, when the entire economy collapses and the world seems to be coming to an end – that’s when they’ll have public support to roll out the new digital system.
They’ll claim, “Here’s the solution. This will restore your fortunes!”
Just enter the new system, and they’ll restore the funds in your bank account, the funds in your retirement account, and they’ll have the regulatory authority to make sure nothing like this ever happens again. The downside?
Only this – you’ll have to give up your privacy and enter a new digital system with control over every aspect of your life. They won’t sell it as that. But people will buy it.
Such a system is coming. The Bible foretold it almost 2,000 years ago in the Book of Revelation:
“He required everyone - small and great, rich and poor, free and slave - to be given a mark on the right hand or on the forehead. And no one could buy or sell anything without that mark, which was either the name of the beast or the number representing his name.” Revelation 13:16-17 (NLT)
Here, we read about the mark of the beast system, and what it’s able to do. And again, what it does is indistinguishable in capability and function from what this new system will be able to do.
We are watching the infrastructure for such a system being built right before our eyes.
And Jesus said this:
“So when all these things begin to happen, stand and look up, for your salvation is near!” Luke 21:28 (NLT)
Jesus is coming back.
So keep your eyes fixed on Him (Hebrews 12:2). He’s our hope in an otherwise hopeless world.
If you like this article, click the “Share” button above to share it with your loved ones and spread the Good News of Jesus! Also, please click the ❤️ button or re-stack buttons below so more people can discover this information on Substack 🙏
I have been listening/reading your comments about economics...and I still don't understand digital assets! Honestly, I still write checks! I am a dinosaur! Help me understand!
Many analysts remain confident it’s not a 1929 repeat. But whatever correction hits, digital will be instituted across the board. Technocratic government.